A folder of thermal images is not yet an inspection result. Owners, O&M teams, insurers and buyers need a solar thermography report that states where each anomaly is, how it was assessed, what should happen next and what the inspection did not cover. This page shows a report structure that works for rooftop systems and solar farms alike, and you can download a complete sample report as PDF.
Sample report (PDF, 6 pages)
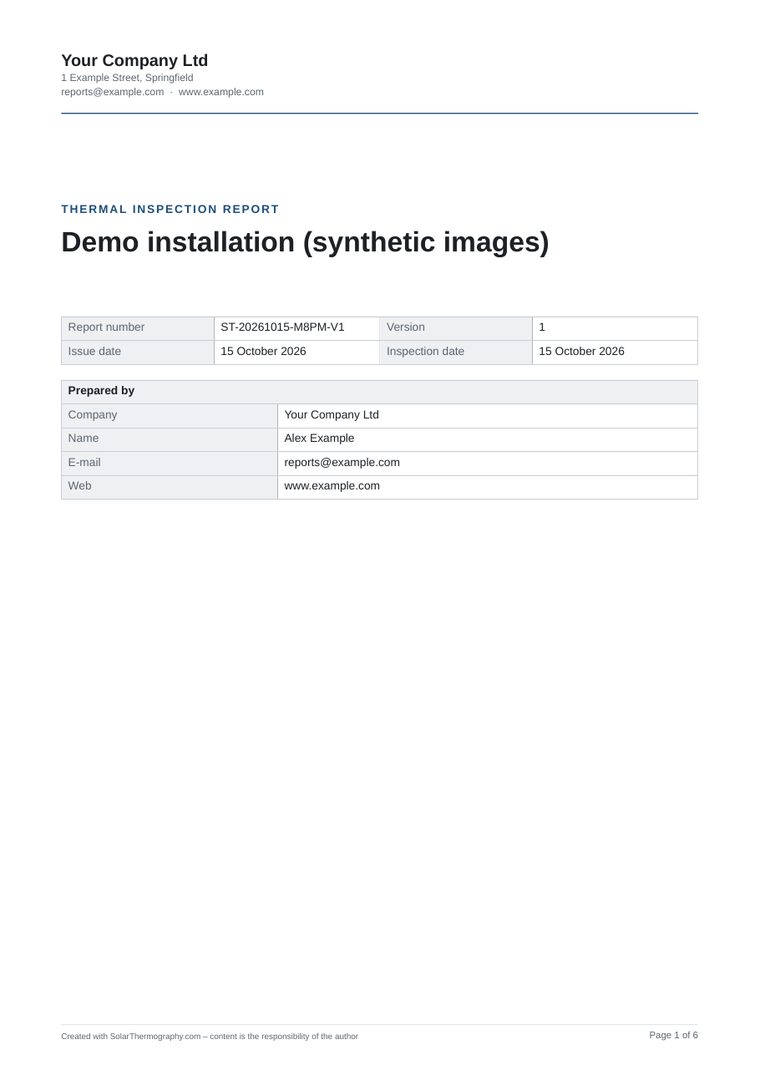
Thermal inspection report for a 9.6 kWp rooftop array with two findings: a single-cell hotspot and a warm sub-string. The images are synthetic; the structure is the one used for real inspections.
Download sample PDFSee the structureReport Structure at a Glance
The sections below follow the numbered structure of the sample report. Each one answers a question the reader of the report will ask.
| Section | What it contains | Question it answers |
|---|---|---|
| Cover | Installation and site address, overview photo, report number, version, issue and inspection date, client, author | Which report is this, and who is responsible for it? |
| 1 Summary | Summary, overall assessment, results at a glance: images reviewed, findings by priority, affected modules | What do I need to know if I read only one page? |
| 1.3 List of findings | One line per finding: number, module, observation, priority, cause status | Where is each problem, at a glance? |
| 2 Installation and inspection | Module type and power, module count, capacity; irradiance in the module plane, ambient temperature, wind, cloud cover; method; scope and areas not inspected | Which installation is it, and were the conditions right for thermography? |
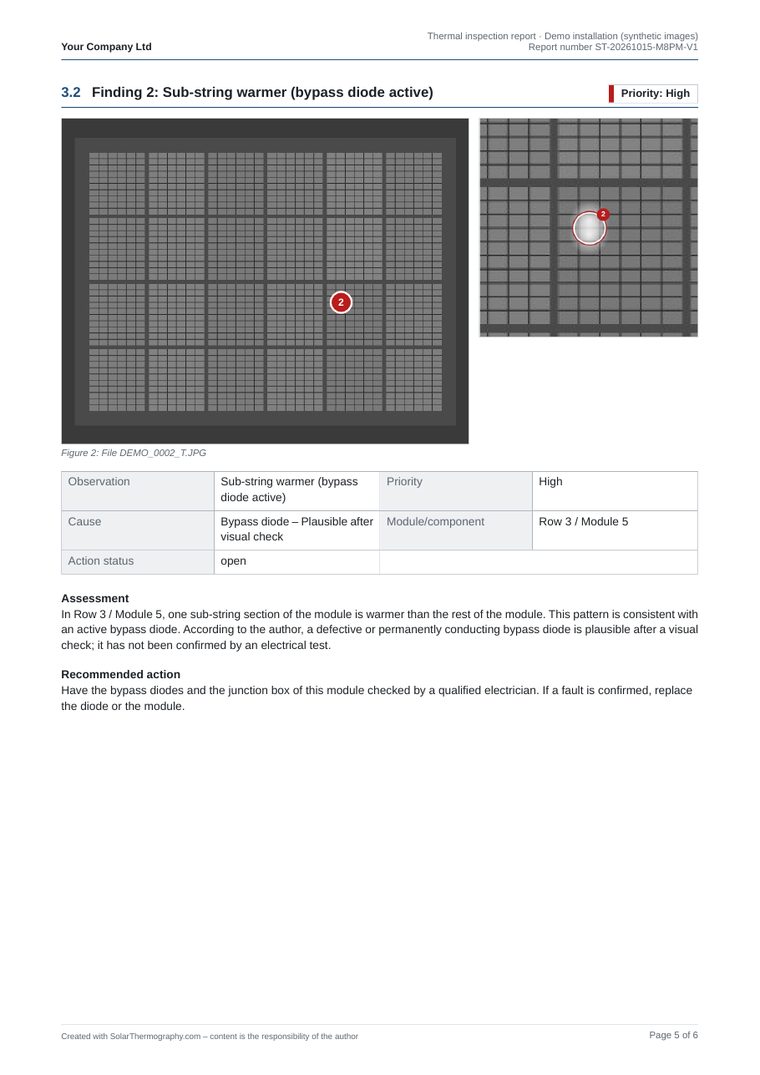
| 3 Findings | Priority scale, then one page per finding: marked thermal image, close-up, figure caption, location, observation, cause status, assessment, recommended action | What exactly did you see, and what should be done? |
| 4 Next steps | Actions in order of urgency | What happens now, and in which order? |
| 5 Limitations | Missing data, uninspected areas, method limits | Where are the limits of this result? |
| 6 Notes and release | Notes on the report, release with name, date and signature | Who stands behind the report? |
One Finding, One Page
The finding pages carry the report. Each finding gets a number, the thermal image with the anomaly marked, a close-up and a module or string reference that a technician can find on site. The observation (“one cell clearly warmer than its neighbours”) is kept apart from the suspected cause (“cracked cell or soiling”), and the cause gets a status: unconfirmed, plausible after a visual check, or confirmed by a test.
For the typical thermal patterns and what they usually mean, see solar panel hotspots: causes, detection and risk.
Inspection Conditions Belong in the Report
A thermal image only shows a meaningful temperature pattern when the modules are under load. That is why thermography of PV modules is done at high, stable irradiance in the module plane; IEC TS 62446-3 sets a minimum of 600 W/m². Record irradiance, ambient temperature, wind, cloud cover and the operating state of the strings at the time of capture, and say whether temperatures were measured radiometrically or the images were reviewed qualitatively. A reader who was not on site can then judge the result.
How the Template Relates to IEC TS 62446-3
IEC TS 62446-3 describes outdoor infrared thermography of PV modules and plants, including the conditions for the inspection and what it should document. A template helps you document consistently, but it does not make an inspection compliant on its own: that depends on the equipment, the conditions and the qualification of the people who carry out and assess the inspection. The specification sorts findings into three classes of abnormality (CoA 1 no abnormality, CoA 2 thermal abnormality, CoA 3 safety-relevant thermal abnormality). If your priority scale is your own, say so in the report instead of presenting it as an IEC classification. More background: IEC 62446-3 standard explained and what an IEC 62446-3 report contains.
Checklist Before You Send the Report
- Every finding has a number, a location and a marked image.
- Observation and cause are written separately; the cause has a status.
- Every finding has a concrete recommended action.
- Conditions at the time of capture are recorded.
- Areas that were not inspected are named.
- The priority scale is explained in the report.
- Limitations and the report version are stated.
Common mistake: stating a cause as fact (“defective bypass diode”) when only the thermal pattern was seen. Write what the image shows, name the likely cause and say how it can be confirmed.